EVALUATING STRENGTH AND CONDITIONING TESTS WITH Z SCORES: AVOIDING COMMON PITFALLS [Article Review]
Whistle Performance
September 21, 2026
Strength and conditioning specialists regularly administer multi-test batteries—combining metrics such as vertical jumps, sprint times, and strength maxes—to evaluate total athletic performance. However, unlike major professional sports organizations equipped with dedicated data science departments, most high school, collegiate, and private strength coaches must analyze their own data using widely accessible spreadsheet software like Microsoft Excel. While foundational industry textbooks and certifying body manuals provide standard statistical formulas and normative tables, they consistently fail to address practical spreadsheet execution or explain how to properly aggregate distinct fitness metrics into a single, valid composite athletic score.
Traditional evaluation methods typically rely on calculating raw team averages or averaging an athlete’s percentile ranks across multiple tests. Averaging percentile ranks, however, generates mathematically flawed composite scores because percentile scales compress data and completely ignore differences in variance (standard deviation) between different physical tests.
Without converting raw scores to standardized Z-scores, unadjusted metrics introduce severe evaluation biases:
The paper illustrates core statistical principles and practical calculation pitfalls through specific numerical examples:
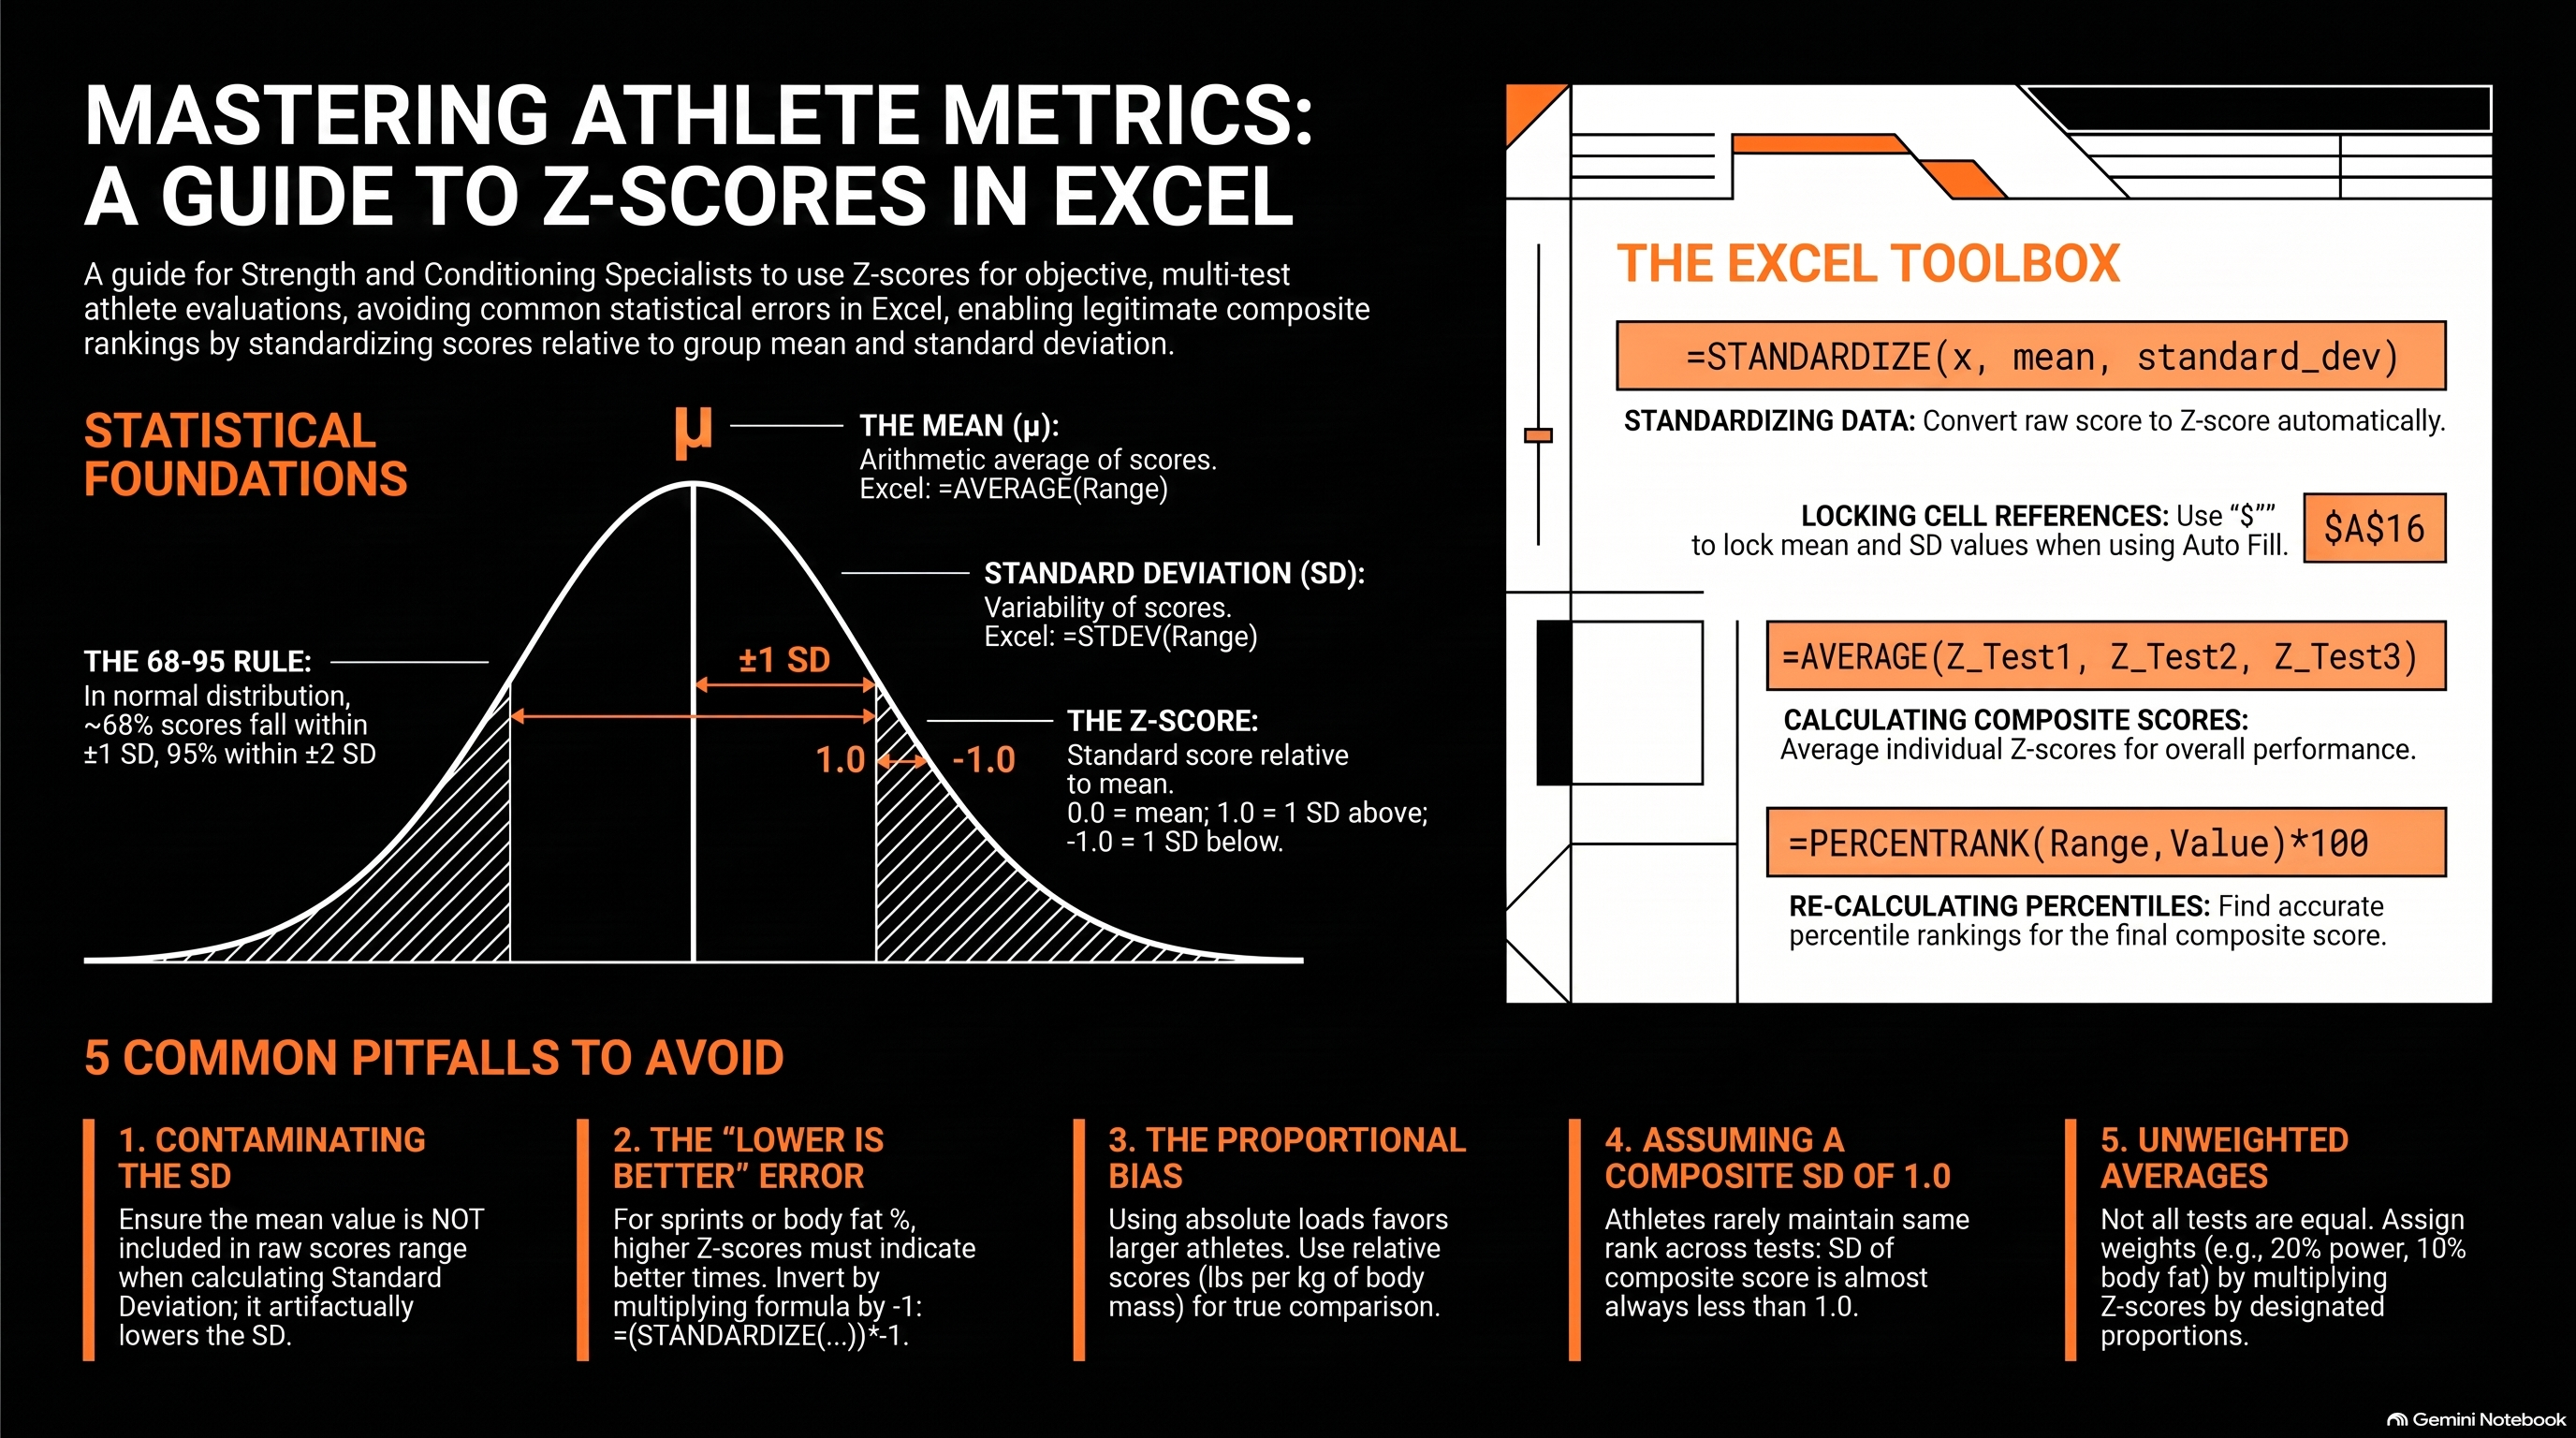
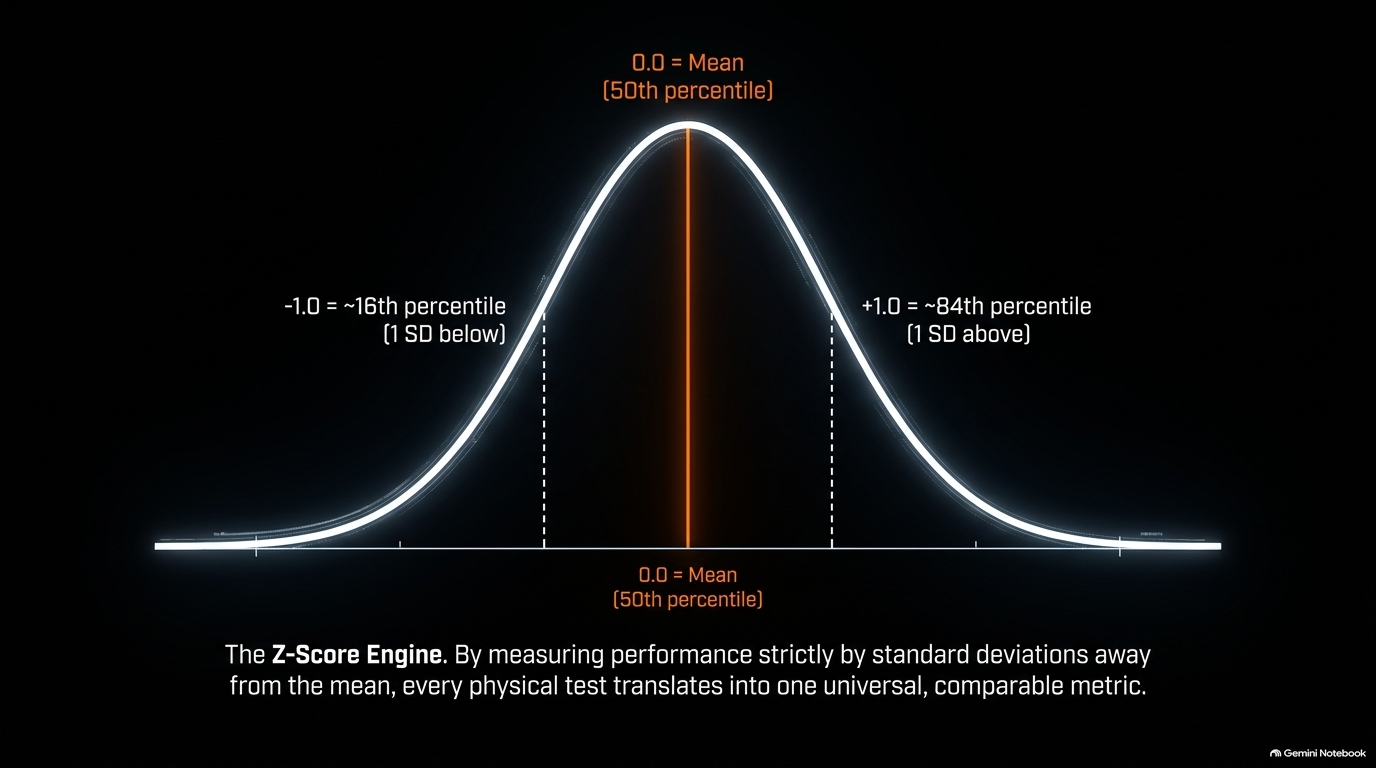
Normal Distribution and Score Interpretation: In a standard normal distribution, approximately 68% of scores fall within plus or minus one standard deviation of the mean, and 95% fall within plus or minus two standard deviations. For a vertical jump test with a team mean of 30 inches and a standard deviation of 3 inches, a jump of 27 inches equates to a -1.0 Z-score (16th percentile), while a jump of 33 inches equates to a +1.0 Z-score (84th percentile).
Timed Metric Inversion: For a 40-yard sprint with a team mean of 4.6 seconds and a standard deviation of 0.8 seconds, a slower time of 5.4 seconds generates an unadjusted Z-score of +1.0. Without multiplying the calculation by -1 to invert it, the slower runner is incorrectly ranked as an above-average performer. Multiplying by -1 corrects the Z-score to -1.0, properly placing the athlete at the 16th percentile.
Absolute versus Relative Performance Bias: Comparing two athletes on the bench press shows that an athlete lifting 325 pounds at a body mass of 245 pounds (1.33 times body mass) ranks at the 70th percentile on raw absolute norms, while an athlete lifting 315 pounds at a body mass of 220 pounds (1.43 times body mass) ranks at the 60th percentile. Relying solely on absolute loads deceptively favors the heavier athlete, whereas expressing loads relative to body mass reveals that the lighter athlete possesses superior relative strength per unit of body weight.
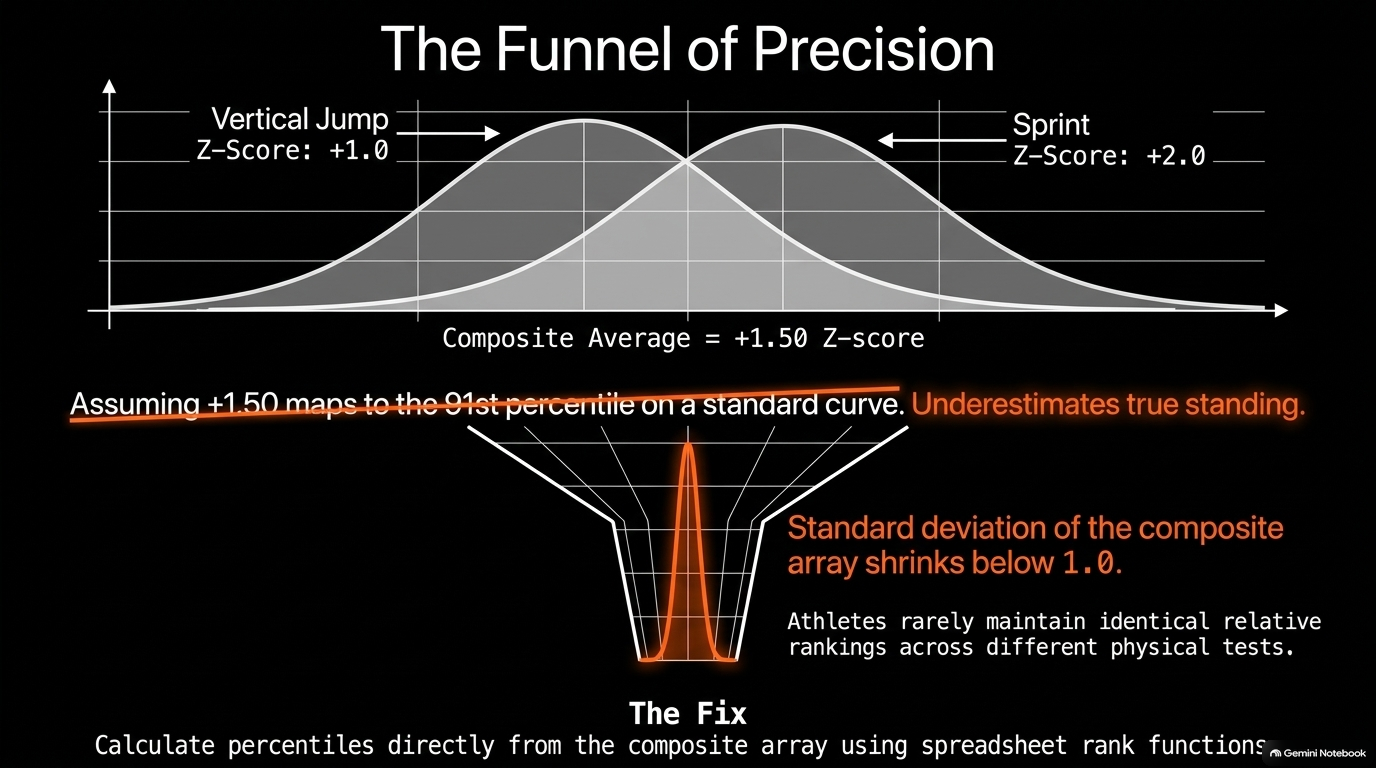
Composite Standard Deviation Shrinkage: When combining scores across multiple tests—such as averaging a vertical jump Z-score of +1.0 and a sprint Z-score of +2.0 to yield a composite Z-score of +1.50—the standard deviation of the composite array shrinks below 1.0 because athletes rarely maintain identical relative rankings across different physical tests. Assuming a +1.50 composite Z-score maps to the 91st percentile on a standard bell curve underestimates the athlete's true standing. Calculating percentiles directly from the team's composite array using spreadsheet rank functions corrects for this shrinkage.
Author's Conclusion
Dr. Pettitt concludes that although evaluating multi-test athletic batteries can seem as complex as advanced professional sports analytics, coaches can easily execute mathematically sound assessments using standard spreadsheet software. The paper demonstrates that traditional shortcuts—such as averaging percentile ranks or assuming a composite score maps directly to a standard normal curve—corrupt athletic evaluations because athletes rarely maintain identical relative rankings across different physical tests, causing the standard deviation of composite score arrays to shrink below 1.0.
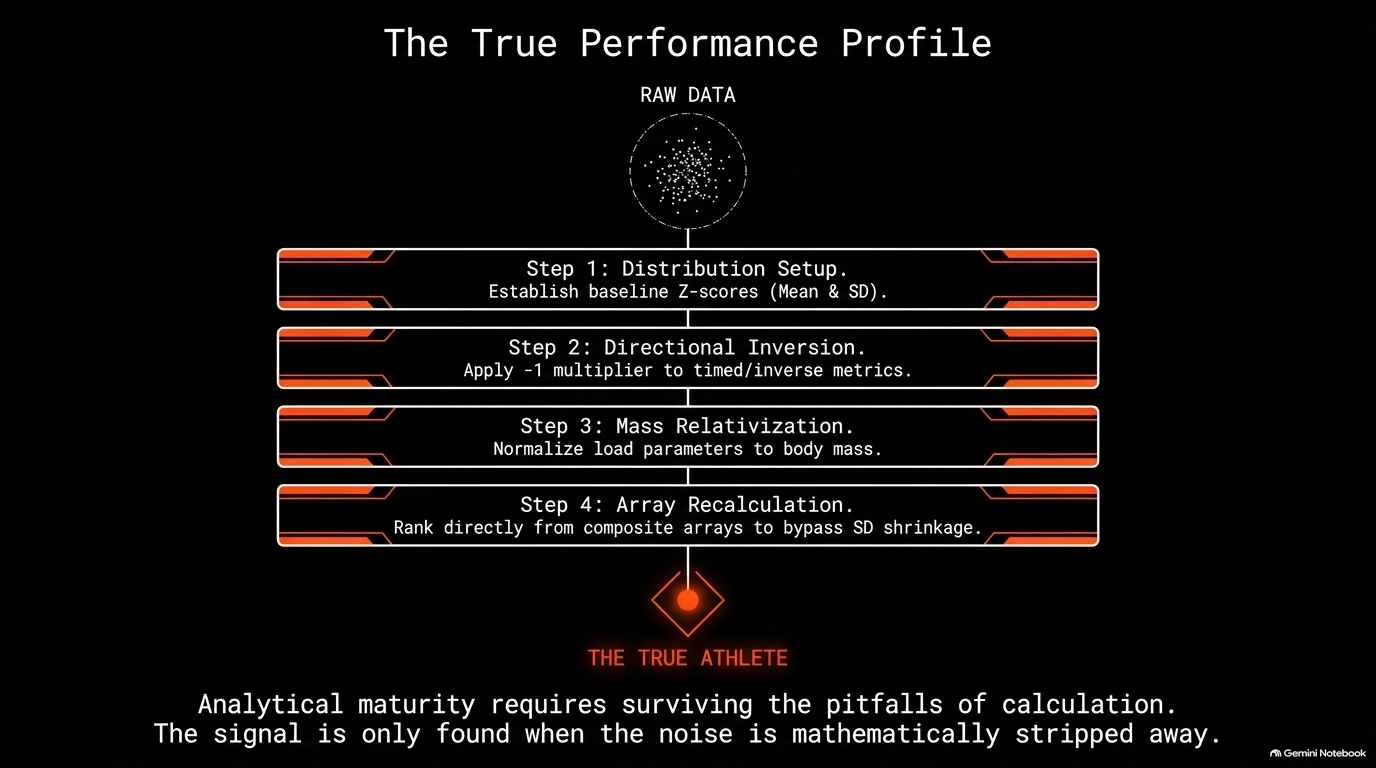
To obtain a truly objective picture of team performance, coaches must systematically apply targeted statistical corrections: inverting timed metrics by multiplying formulas by -1 so faster performances yield positive scores, converting absolute loads into relative metrics based on body mass to eliminate size bias, and calculating percentiles directly from the composite Z-score array using rank functions. By addressing these computational pitfalls, strength and conditioning specialists can transform raw multi-test batteries into an accurate, unbiased evaluation of each athlete's physical profile and true overall rank within the team.
Key Takeaways for Sport Performance and Sport Science
Convert raw test metrics into Z-scores before combining them into a composite score, rather than averaging raw test scores or raw percentile ranks.
Express absolute measures of strength, power, and distance as relative metrics based on body mass or height to eliminate body-size bias.
Invert Z-score formulas for timed events, body fat percentages, and error counts so that superior athletic performances consistently yield positive values.
Derive exact team percentile rankings directly from composite Z-score arrays using spreadsheet rank functions to account for standard deviation shrinkage.
Assign weighted proportions to individual test Z-scores in consultation with sport coaches so the composite evaluation reflects specific positional and energy-system demands.
Exclude corrupted or invalid test entries, such as performances impacted by injury or technical breaches, prior to establishing baseline team averages and standard deviations.
Article Reference
Pettitt, R. W. (2010). Evaluating strength and conditioning tests with Z scores: Avoiding common pitfalls.Strength and Conditioning Journal, 32(5), 100–103.
what to read next
ANALYSIS OF Z-SCORE AND TOTAL SCORE OF ATHLETICISM ON DRAFTED AND UNDRAFTED PLAYERS FROM THE NFL SCOUTING COMBINE [Article Review]
This study analyzed NFL Scouting Combine data from 2000 to 2024 to evaluate how effectively standardized Z-scores and the Total Score of Athleticism (TSA) can distinguish between drafted and undrafted players . It found that drafted players consistently score significantly higher across these standardized metrics than their undrafted peers . Crucially, calculating Z-scores within specific positional groups (skill players, big skill players, and linemen) provides much stronger predictive power than evaluating players against a general combine average . While the 40-yard dash Z-score stands out as the single best individual predictor of draft selection across all positions , upper-body metrics like the bench press are virtually irrelevant for skill players but become highly predictive in the trenches for linemen