
September 28, 2026
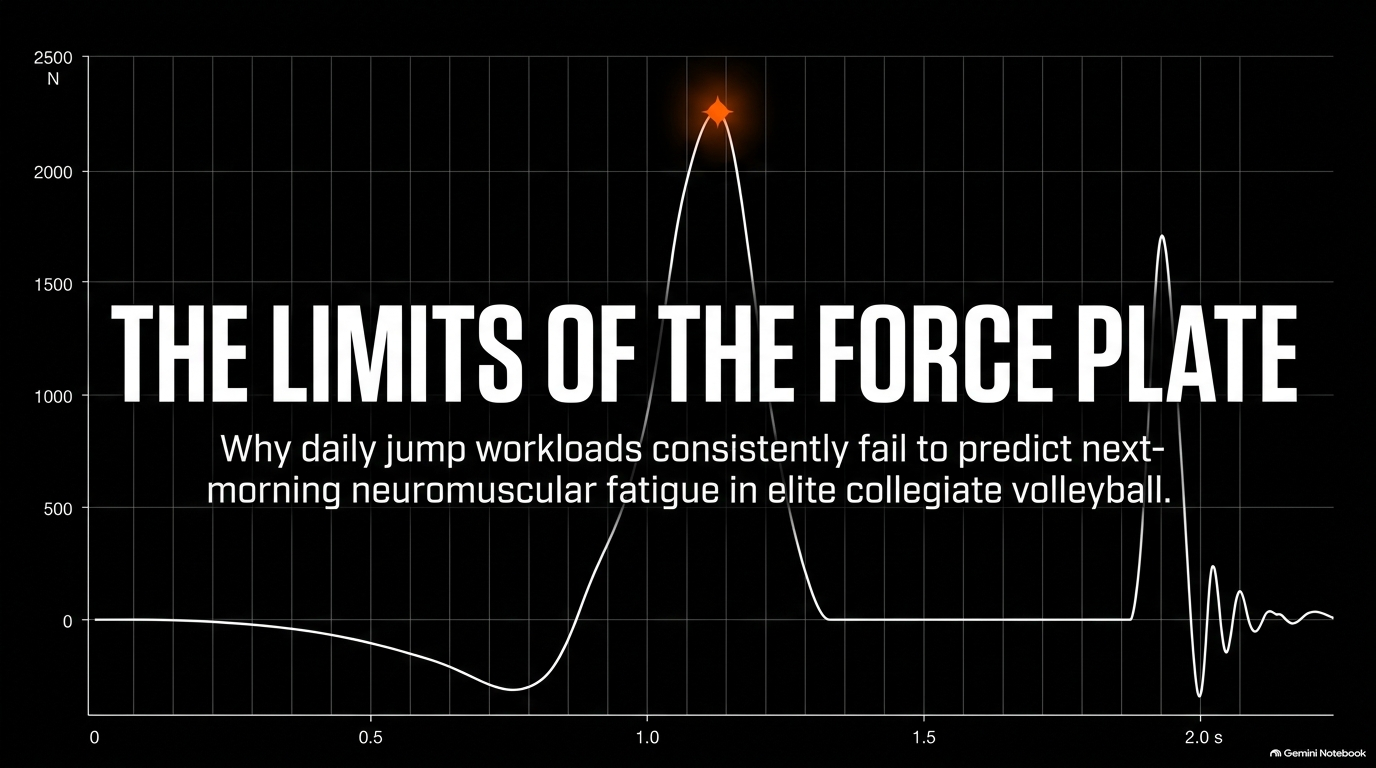
In high-performance volleyball, strength and conditioning coaches routinely rely on force plate testing—specifically the countermovement jump (CMJ)—to monitor neuromuscular fatigue and daily athlete readiness. Because elite volleyball athletes execute thousands of vertical jumps and high-impact landings over a competitive season, tracking external movement stress is critical for optimizing recovery. However, the exact link between prior-day external workloads and next-morning jump performance has long remained ambiguous.
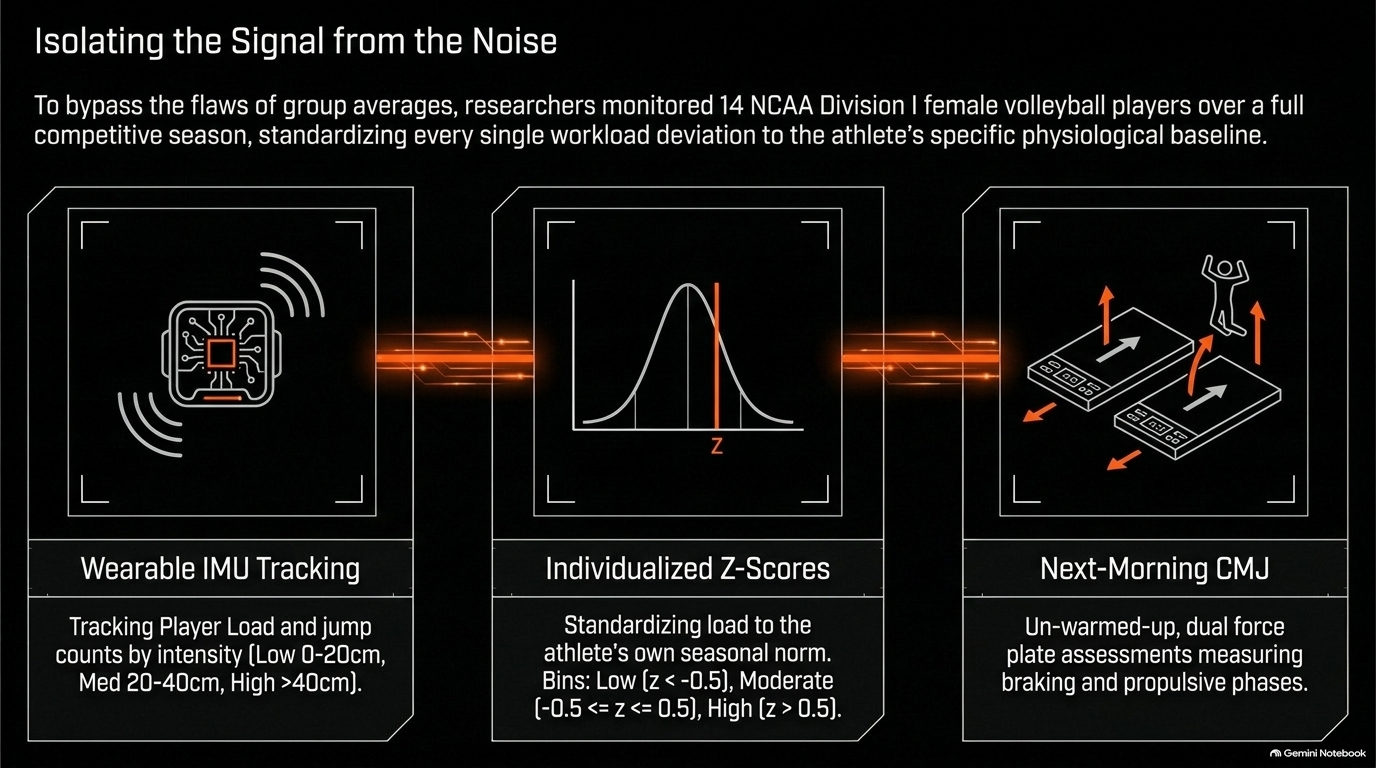
To address this gap, researchers Gabriel J. Sanders, James Stampley, Ben Parker, Stacie Skodinski, and Corey A. Peacock conducted a season-long investigation in NCAA Division I female volleyball athletes. The research team sought to evaluate whether daily deviations in external workload—measured via inertial measurement units for Player Load and jump counts across low, medium, and high intensity bands—were associated with changes in next-morning force, velocity, and power outputs during CMJ testing. To overcome the limitations of group-average models and acute-to-chronic workload ratios, the authors implemented an individualized z-score approach, categorizing each athlete's daily training exposure as low (z less than -0.5), moderate (z between -0.5 and 0.5), or high (z greater than 0.5) relative to her own seasonal norm.
The investigation revealed a striking contrast between external workload exposure and subsequent neuromuscular output:
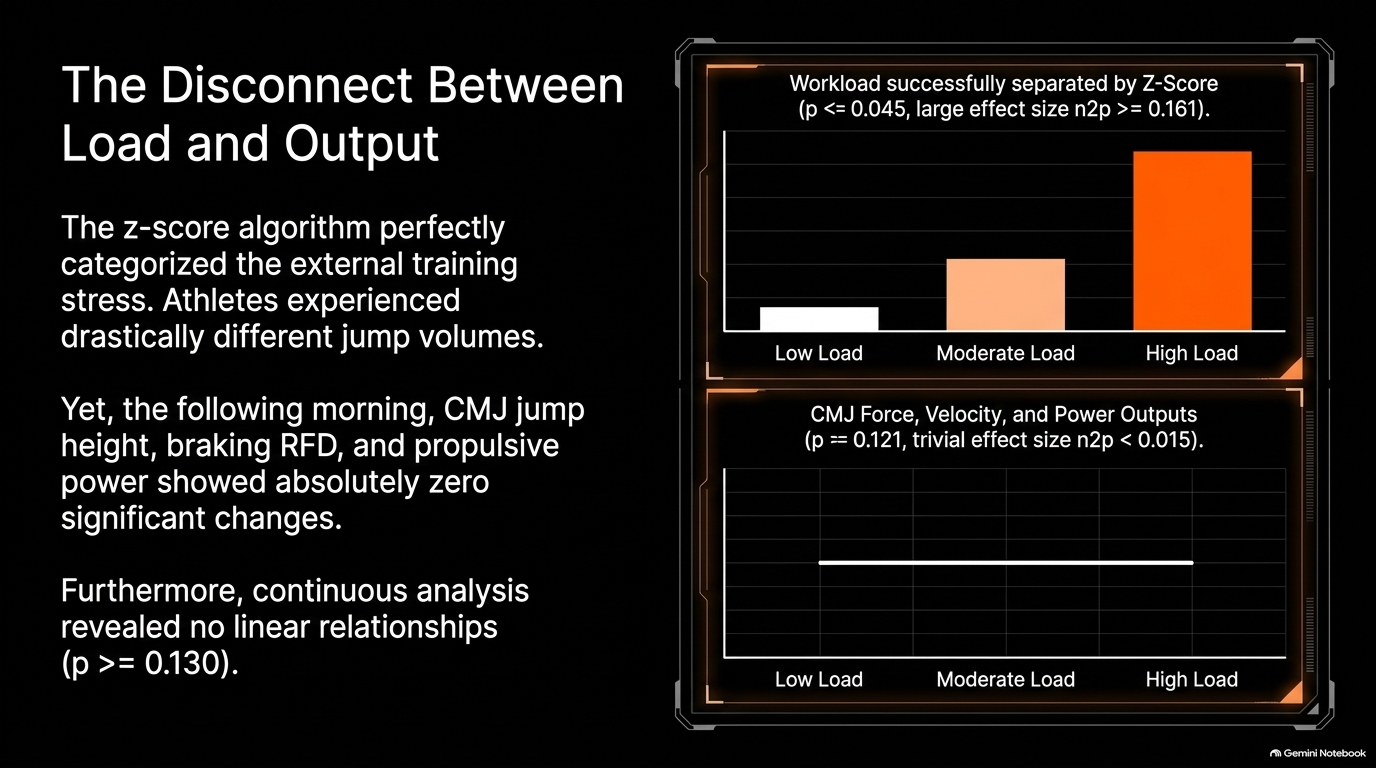
Categorizing daily training data into intra-athlete z-scores successfully separated actual physical stress, demonstrating statistically significant differences across low, moderate, and high workload days for Player Load and jump counts.
Despite clear separation in prior-day physical stress, higher workload days caused no significant decrements in next-morning CMJ performance. Metrics across all phases—including braking rate of force development, peak and average braking and propulsive forces, velocities, power outputs, countermovement depth, and jump height—remained stable.
Across all measured CMJ metrics, effect sizes were uniformly trivial, and continuous linear correlations between workload z-scores and jump variables were non-significant.
These findings demonstrate that for well-conditioned collegiate athletes, standard in-season fluctuations in daily jump volume fall comfortably within their normal adaptive capacity.
The study provides valuable insights for strength coaches, sport scientists, and athletic trainers designing monitoring frameworks:
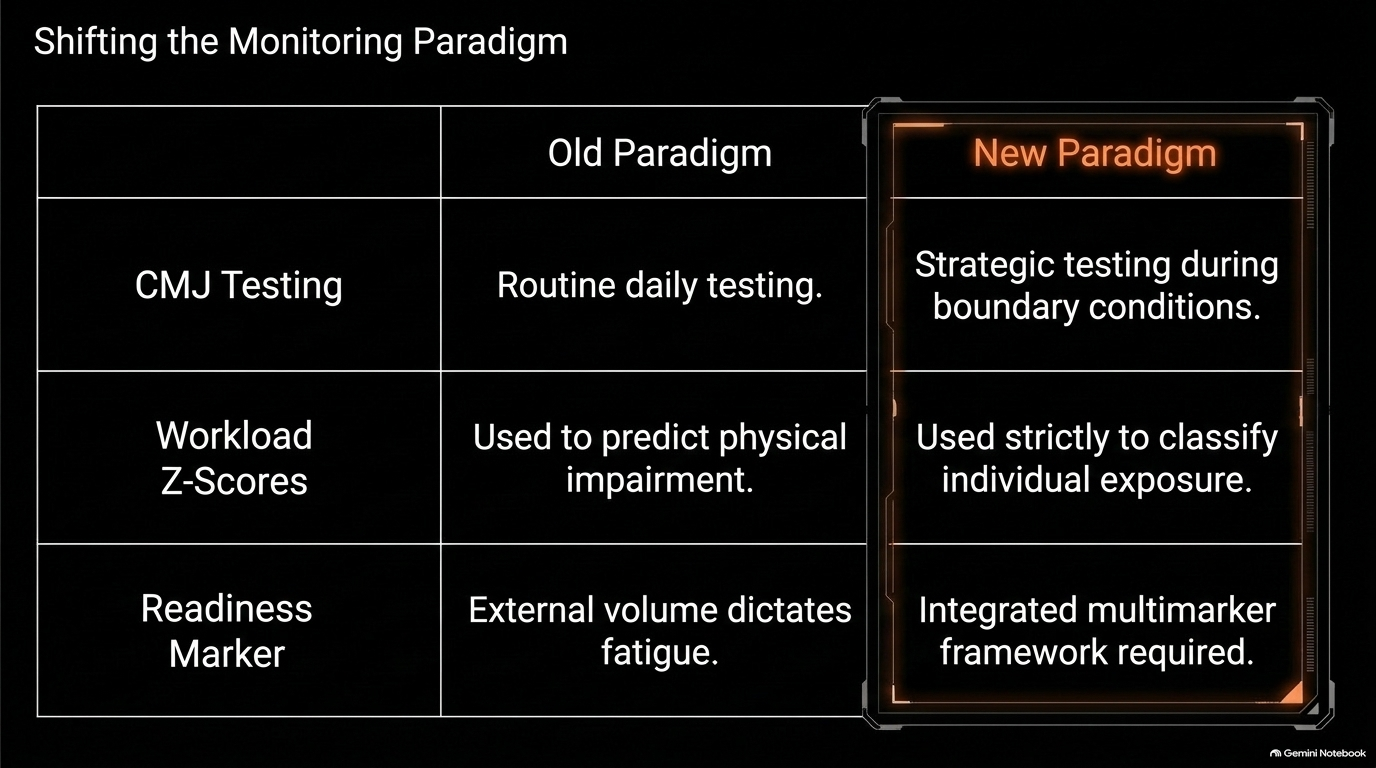
Re-evaluate Daily Testing Frequency: Daily CMJ testing is generally insensitive to routine, day-to-day fluctuations in external jump volume. An isolated spike in training volume does not automatically indicate neuromuscular fatigue or require immediate load reduction the following morning.
Deploy Force Plates Strategically: Rather than testing every single morning, force plate assessments yield their highest diagnostic value during boundary conditions—such as intentional overload blocks, congested competition windows, intensive preseason phases, or return-to-play progressions.
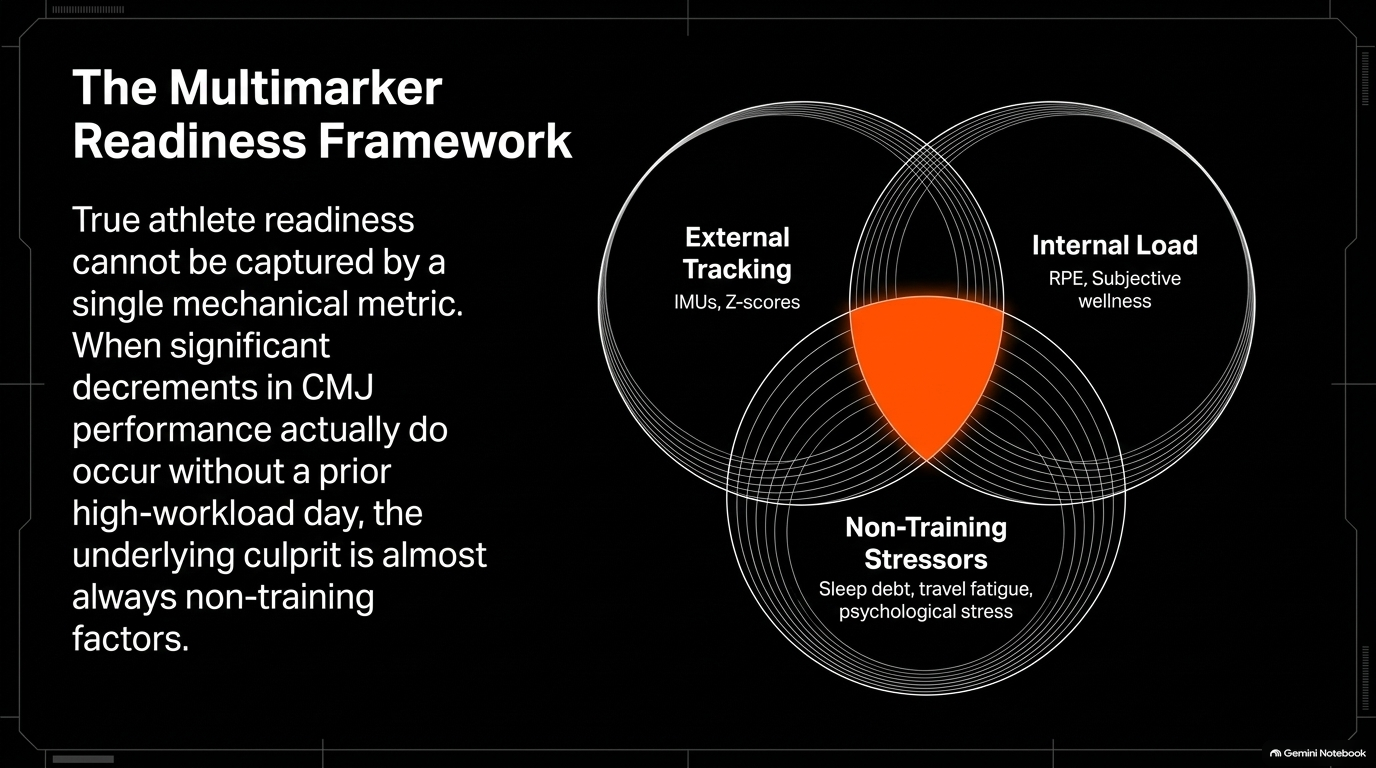
Adopt a Multimarker Readiness Framework: External volume metrics quantify mechanical exposure, but external load alone does not dictate acute neuromuscular status. When genuine drops in jump performance occur without a prior workload spike, non-training stressors such as sleep loss, poor nutrition, psychological stress, or travel fatigue are often the primary drivers.
Use Z-Scores to Track Exposure, Not Impairment: Individualized workload z-scores are an effective, mathematically sound tool for classifying individual training exposures relative to an athlete's norm. However, coaches should use workload z-scores to monitor training distribution rather than assuming a high z-score day automatically predicts physical impairment.
Article Reference
Sanders, G. J., Stampley, J., Parker, B., Skodinski, S., & Peacock, C. A. (2026). Individualized Z-score classification of jump load and its association with countermovement jump performance throughout a Division I volleyball season. Journal of Strength and Conditioning Research, Advance online publication