
August 31, 2026
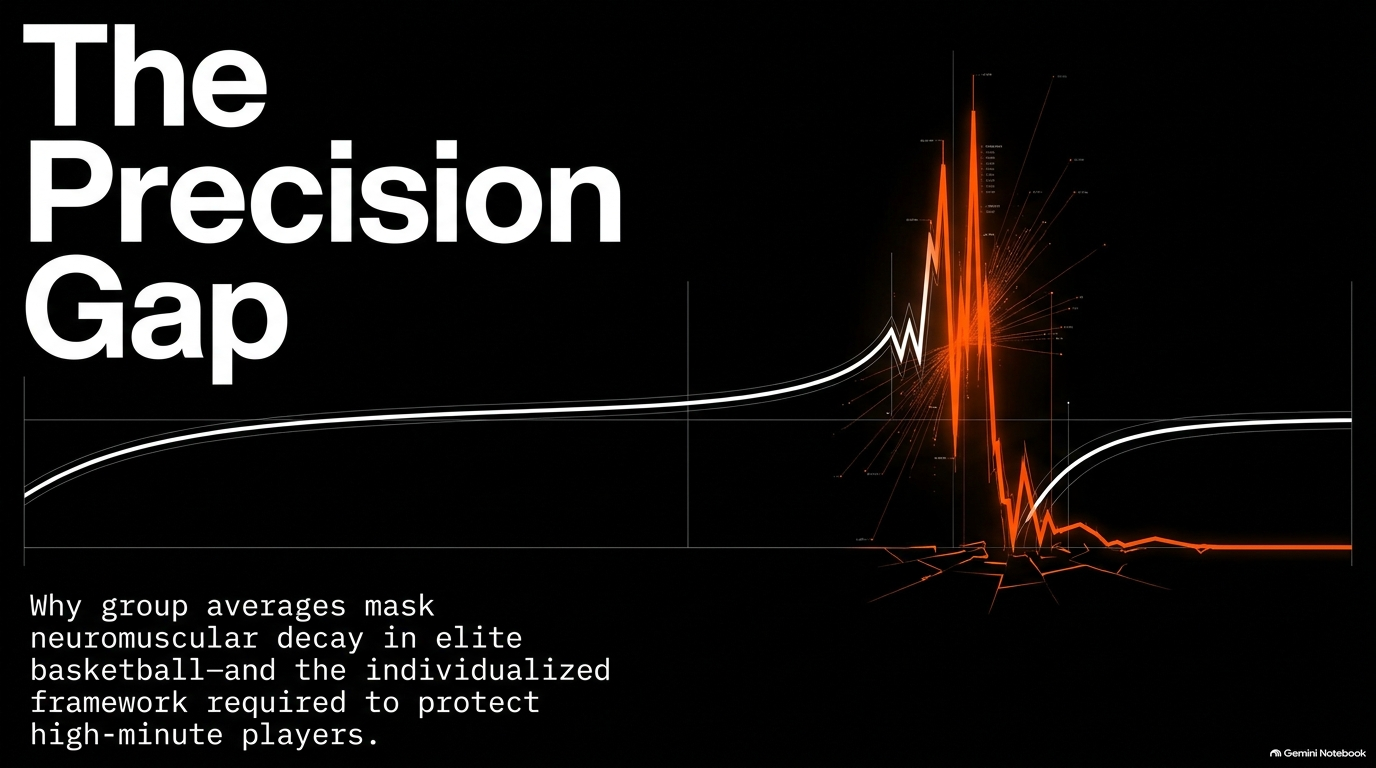
In the high-stakes theater of Division I basketball, the margin between post-season success and neuromuscular collapse often rests on the readiness of a core rotation. While athlete-monitoring systems have become ubiquitous in high-performance departments, traditional analytical methods frequently fail to protect those high-minute players who carry the heaviest physiological burden. The intensity of a modern season—characterized by condensed schedules, travel-related circadian disruption, and rigorous practices—demands an evolution from "team-wide trends" to "athlete-specific signatures." To bridge this gap, we must utilize advanced hardware, such as Hawkin Dynamics wireless dual force plates, to move beyond aggregate data that often dilutes the fatigue of a star starter with the fresh legs of a bench player.
A comprehensive high-performance monitoring strategy must integrate data across five primary physiological and psychological domains to triangulate a true picture of athlete readiness:
The challenge is amplified in "small squad" sports like basketball, where the "sex data gap"—the historical under-representation of female athletes in sports science research—remains a barrier to evidence-based protocols. Furthermore, the dual-career demands on collegiate athletes, including significant academic stressors, necessitate a more rigorous, individualized monitoring protocol. Relying on the "average" in this environment is not just imprecise; it is a fundamental risk to athlete health and team performance.
Historically, sports scientists have relied on team-level analysis, often employing two-way repeated-measures ANCOVA. However, this creates a profound analytical blind spot. In our recent longitudinal study of Division I players, the group-level analysis frequently required the Greenhouse-Geisser adjustment to handle violations of sphericity—a common occurrence in small-sample longitudinal data (n=13). When a coaching staff receives a report citing "non-significant" team-wide results, it fosters a false sense of security while individual performance decay remains hidden beneath the surface of the group mean.
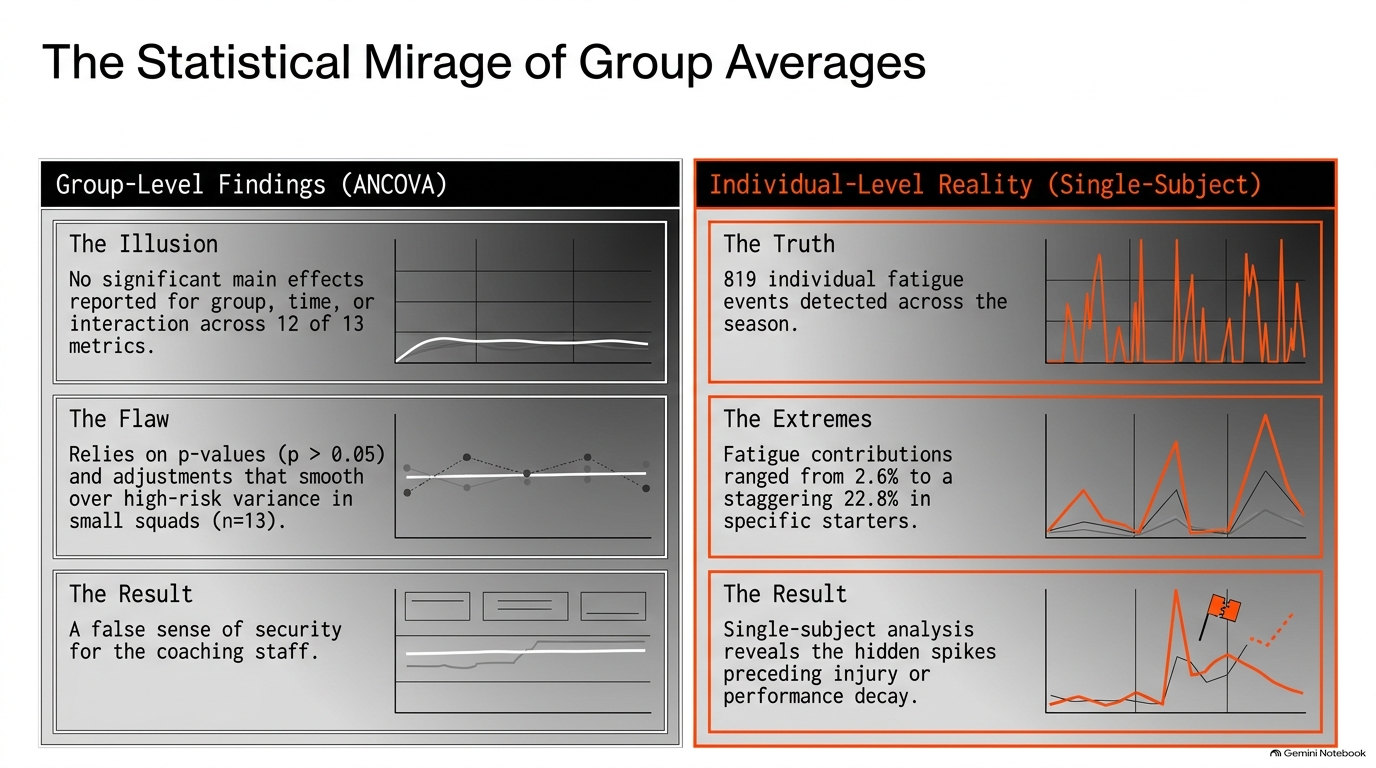
The disconnect between aggregate findings and the individual reality of the court is quantified in the table below:
Group-Level Findings (ANCOVA)
Individual-Level Reality (Single-Subject)
No significant main effects reported for group, time, or interaction across 12 of 13 metrics.
819 individual fatigue events detected across the season.
Modified reactive strength index showed only a simple main effect for high-minute players.
Fatigue contributions ranged from 2.6% to a staggering 22.8% in specific starters.
Reliance on p-values (p > 0.05) masked critical performance decrements.
Single-subject analysis revealed high-risk "spikes" that group averages smoothed over.
Relying on p-values in small squad settings is statistically precarious. Aggregate data inevitably smooths over the very "spikes" in fatigue that correlate with non-contact injury or shooting slumps. By the time a group average reflects a decline, the opportunity for proactive intervention has passed.
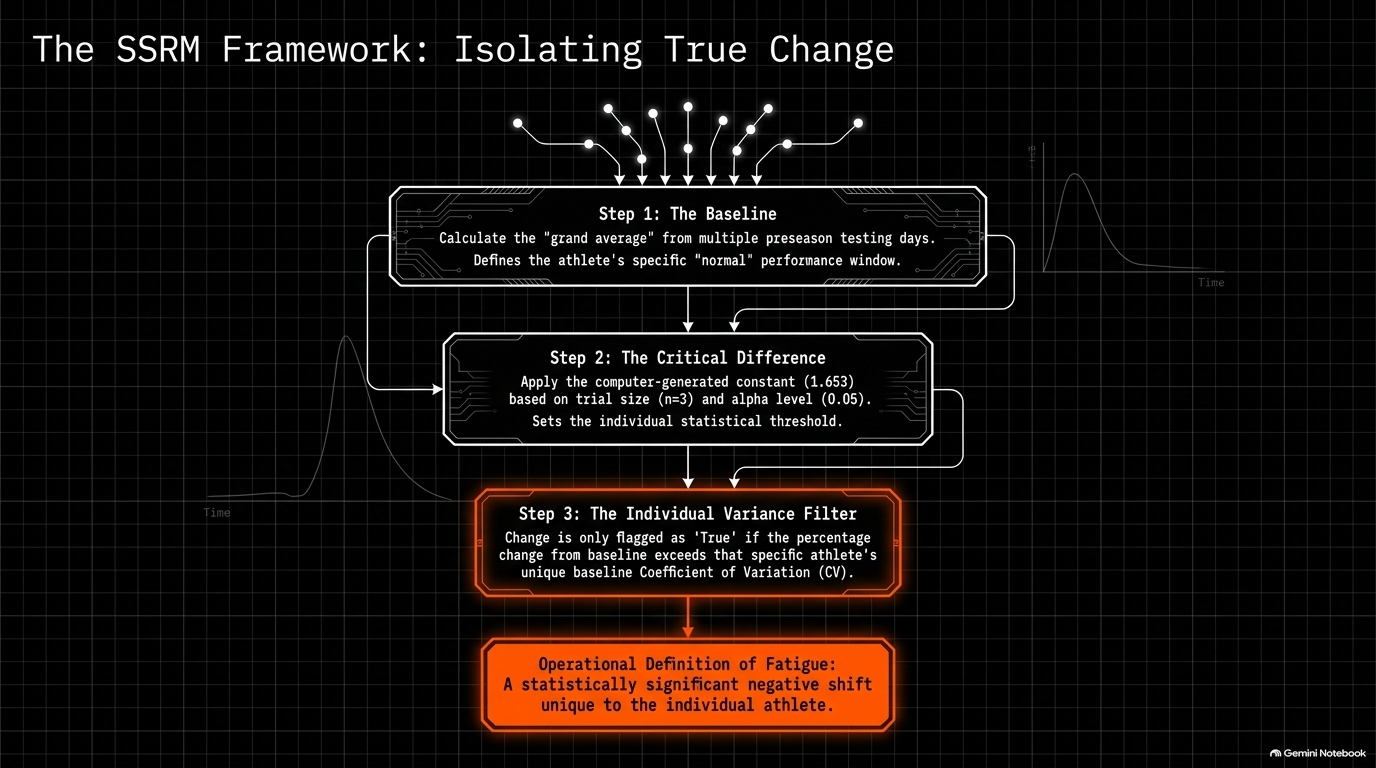
To achieve professional-grade precision, we must adopt a Single-Subject Repeated-Measures (SSRM) design, integrating the Model Statistic (MS) with the Coefficient of Variation (CV). This framework is the gold standard for distinguishing "true change" from the inherent "noise" of daily human performance.
Our operational detection of "True Change" follows a rigorous three-step statistical protocol:
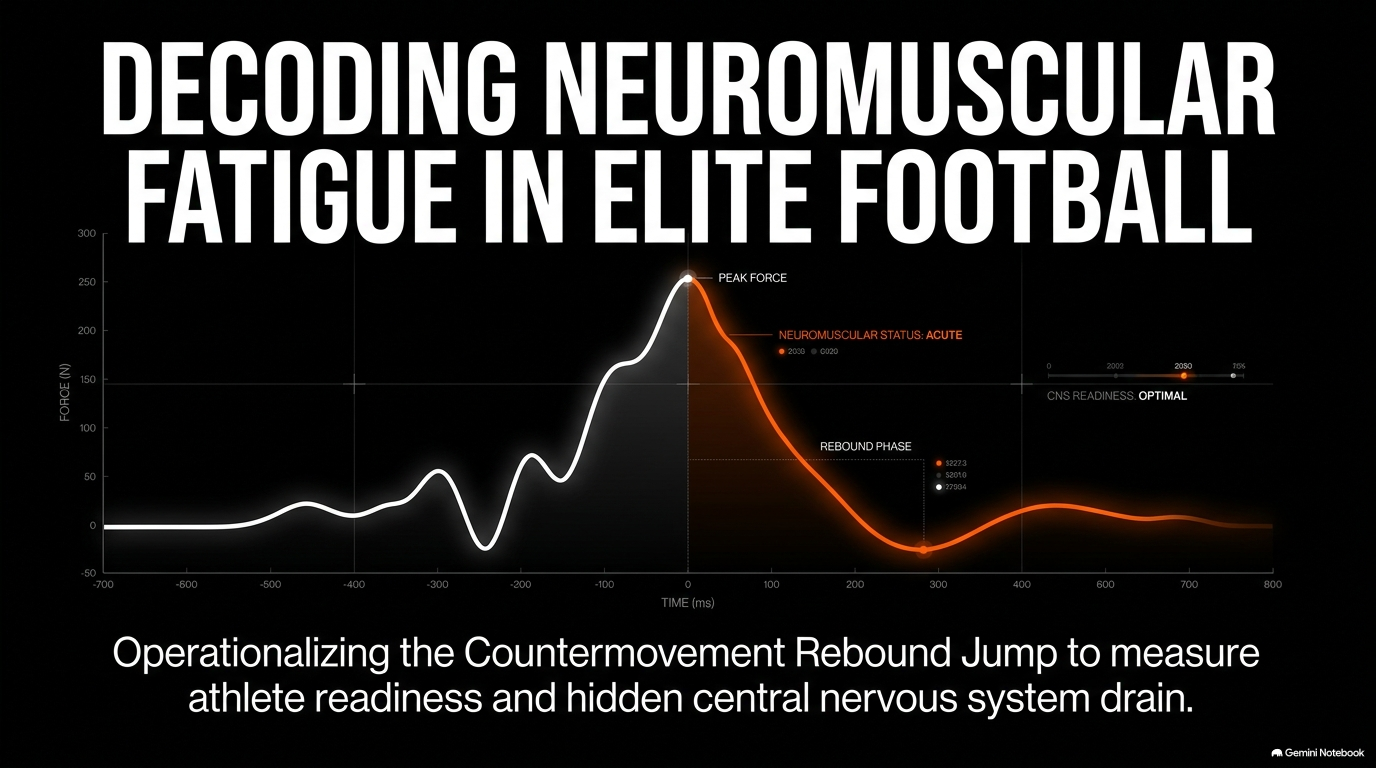
In this framework, the "operational definition of fatigue" is a statistically significant negative shift in metrics such as Jump Height (JH) or Average Braking Power (BP). Furthermore, a significant increase in countermovement depth—effectively "jumping slower"—is flagged as a compensatory strategy used by the neuromuscular system to produce force when the stretch-shortening cycle (SSC) is compromised. This nuance is only visible through the Countermovement Rebound Jump (CMRJ) protocol.
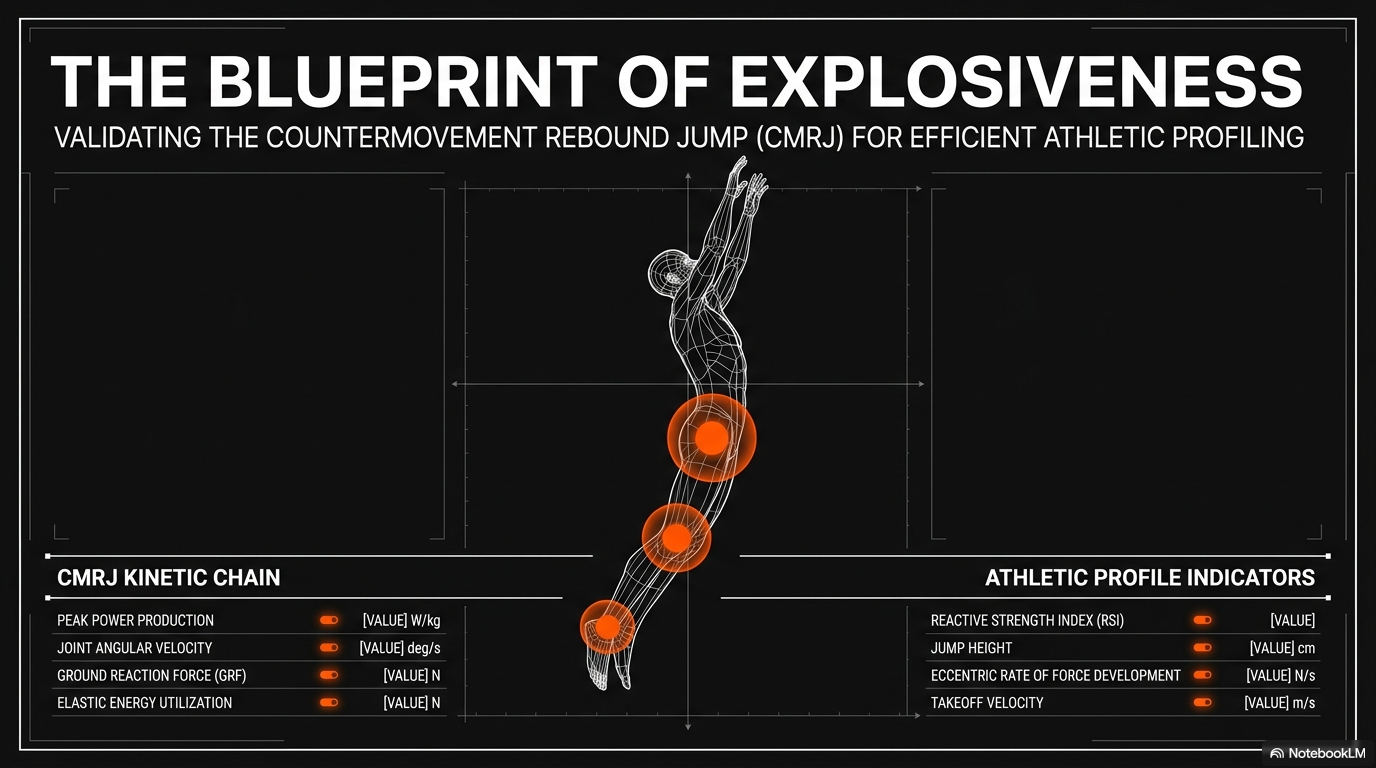
The shift from traditional Countermovement Jumps (CMJ) and Drop Jumps (DJ) to the CMRJ is a strategic pivot toward efficiency and ecological validity. The CMRJ consists of two consecutive jumps, allowing practitioners to assess both explosive power and reactive strength in a single, time-efficient test that avoids the logistical difficulty of controlling drop heights.
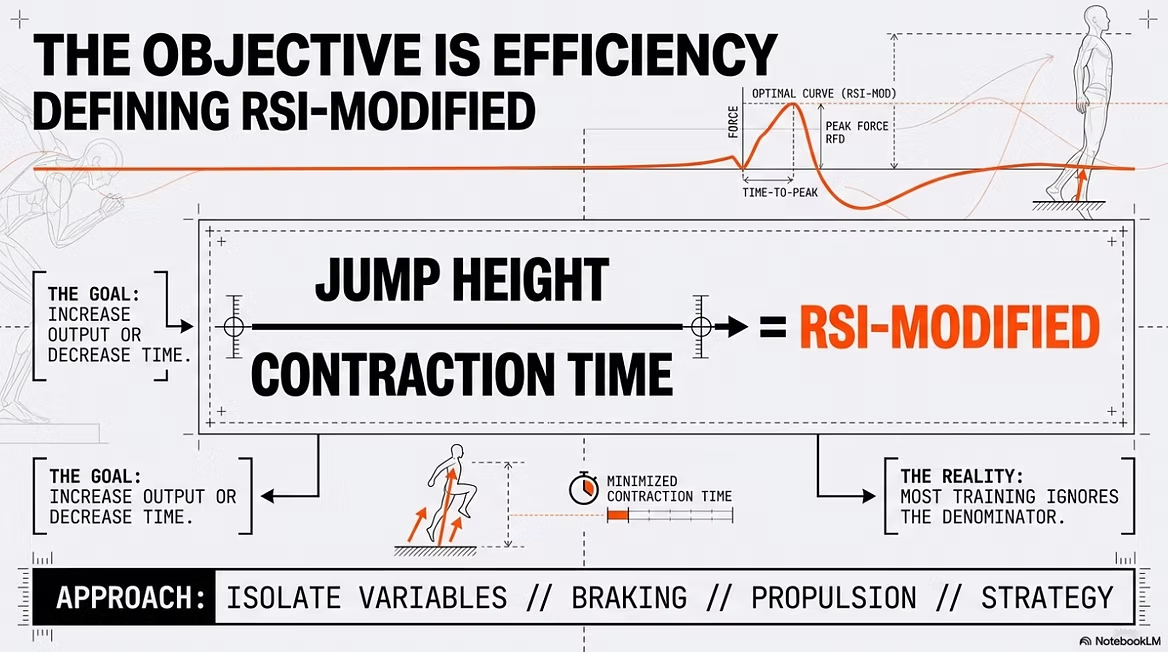
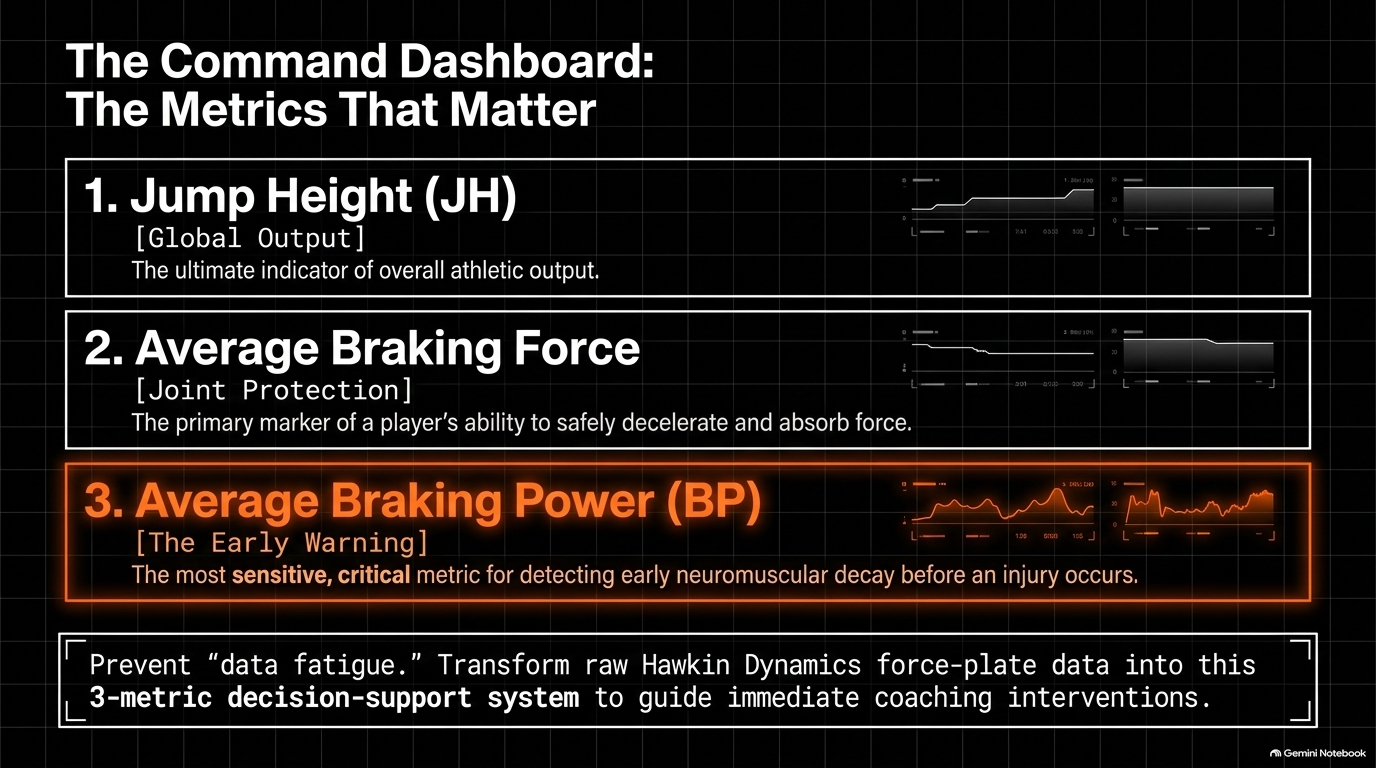
Through our analysis on Hawkin Dynamics plates, we have identified the "metrics that matter" based on their sensitivity to seasonal fatigue:
Reliability remains the cornerstone of this system. Analysis of the team’s internal consistency (represented via Forest Plot data) confirms that 11 of the 13 metrics maintained a CV \leq 10% across 20 testing sessions. However, practitioners must exercise caution with Rebound Depth (11.7% CV) and RB MRSI (10.2% CV), which showed higher variability, likely due to the dynamic nature of the landing-to-rebound transition. The primary value of the CMRJ remains its window into the eccentric braking phase; a decline in braking power is often the earliest harbinger of the neuromuscular fatigue that precedes non-contact lower-extremity injuries.
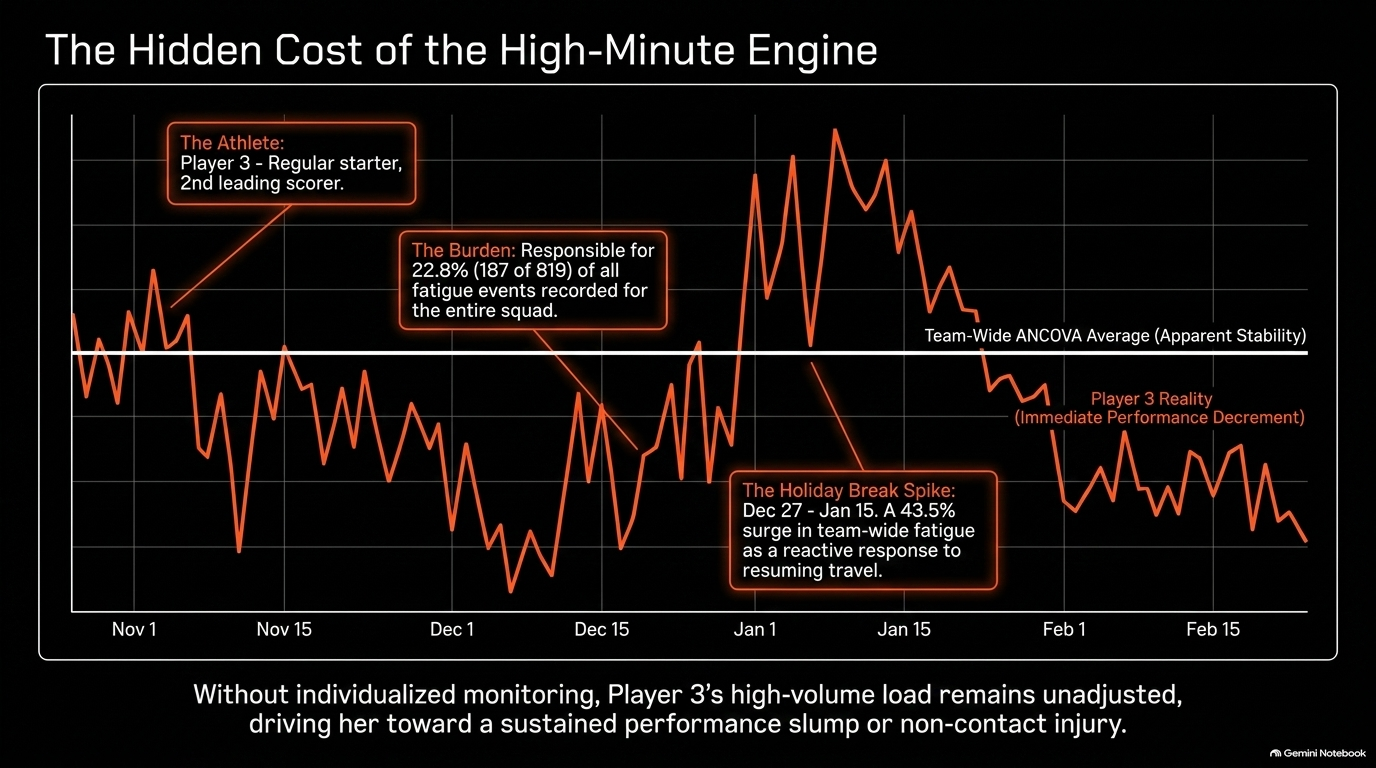
The disproportionate load carried by High-Minute (HM) players creates a "Neuromuscular Price" that aggregate data cannot account for. Because these players are often the team’s primary offensive engines, their readiness dictates the team's ceiling.
Consider "Player 3," a regular starter and the team’s second-leading scorer. While team-wide ANCOVA results suggested stability, Player 3 was responsible for 22.8% of all fatigue events recorded for the entire squad. She exhibited an immediate, early-season performance decrement that was completely invisible in the team average. Without SSRM monitoring, her high-volume load would have remained unadjusted, likely resulting in a sustained performance slump or injury.
Our data also identified a significant "Holiday Break Spike." Between December 27 and January 15, fatigue episodes surged by 43.5%. Crucially, this spike was preceded by a low point on December 27, suggesting the fatigue was a reactive response to the resumption of travel and intense conference play after a period of relative rest.
Finally, a critical distinction in "Jump Strategy" emerged: Low-Minute (LM) players often appeared to have "better" reactive strength metrics. However, this is a statistical mirage. LM players utilized a fast SSC (stretch-shortening cycle) because they possessed "fresh legs." In contrast, HM players were forced into deeper eccentric depths to compensate for power loss, using a slower, more labor-intensive strategy to maintain jump height.
The role of the Principal Sports Scientist is to transform raw force-plate data into a Decision-Support System. When a "True Change" indicates significant fatigue in a key player, we transition from observation to intervention via the following adjustments:
To prevent "data fatigue" within the coaching staff, we recommend a Reductionist Approach. Practitioners should prioritize a "Command Dashboard" featuring the three most reliable and sensitive metrics:
In the high-variance world of elite basketball, the average is the enemy of the exceptional. By adhering to a single-subject mandate, we move beyond the statistical mirage, ensuring our athletes perform at their peak when the stakes are highest.

Article Reference
Ghigiarelli, J. J., Saldutti, D. V., Pottorf, O. A., Sell, K. M., & Gonzalez, A. M. (2025). Individual monitoring of the countermovement rebound jump in Division I female basketball players across a competitive season: Using the model statistic and coefficient of variation approach. Journal of Strength and Conditioning Research, 39(4), 433–446.