THE FLIGHT PHASE: TAKE-OFF VELOCITY VS. FLIGHT TIME IN COUNTERMOVEMENT JUMP TESTING
Whistle Performance
November 16, 2026
THE FLIGHT PHASE: TAKE-OFF VELOCITY VS. FLIGHT TIME IN COUNTERMOVEMENT JUMP TESTING
Understanding countermovement jump (CMJ) force-time curve mechanics requires analyzing what happens after an athlete leaves the ground, as well as how airborne metrics are calculated. While jump height is historically the most sought-after outcome metric, how that metric is derived fundamentally separates legacy jump testing tools from modern force plate analysis.
The section of the jump known as The Flight represents the airborne duration between takeoff and touchdown. It serves as the direct mechanical result of every muscle action, deceleration impulse, and propulsive acceleration generated while the athlete was in contact with the ground.
1. Biomechanical Boundaries and Detection Thresholds
In automated force plate analysis such as Hawkin Dynamics, precise boundary detection is required to evaluate airborne dynamics accurately.
Takeoff Onset: The exact instant when total vertical ground reaction force falls below a designated zero-force threshold (typically set at a small fraction of system weight or zero threshold), signifying that the athlete's feet have fully detached from the plates.
Touchdown Termination: The exact instant when the athlete makes contact with the plates again, causing total vertical force to rise back above the force threshold.
Airborne Mechanics: Once airborne, the athlete's center-of-mass (COM) follows a parabolic vertical trajectory under the constant downward acceleration of gravity.
2. Takeoff Velocity vs. Flight Time: The Calculation Divide
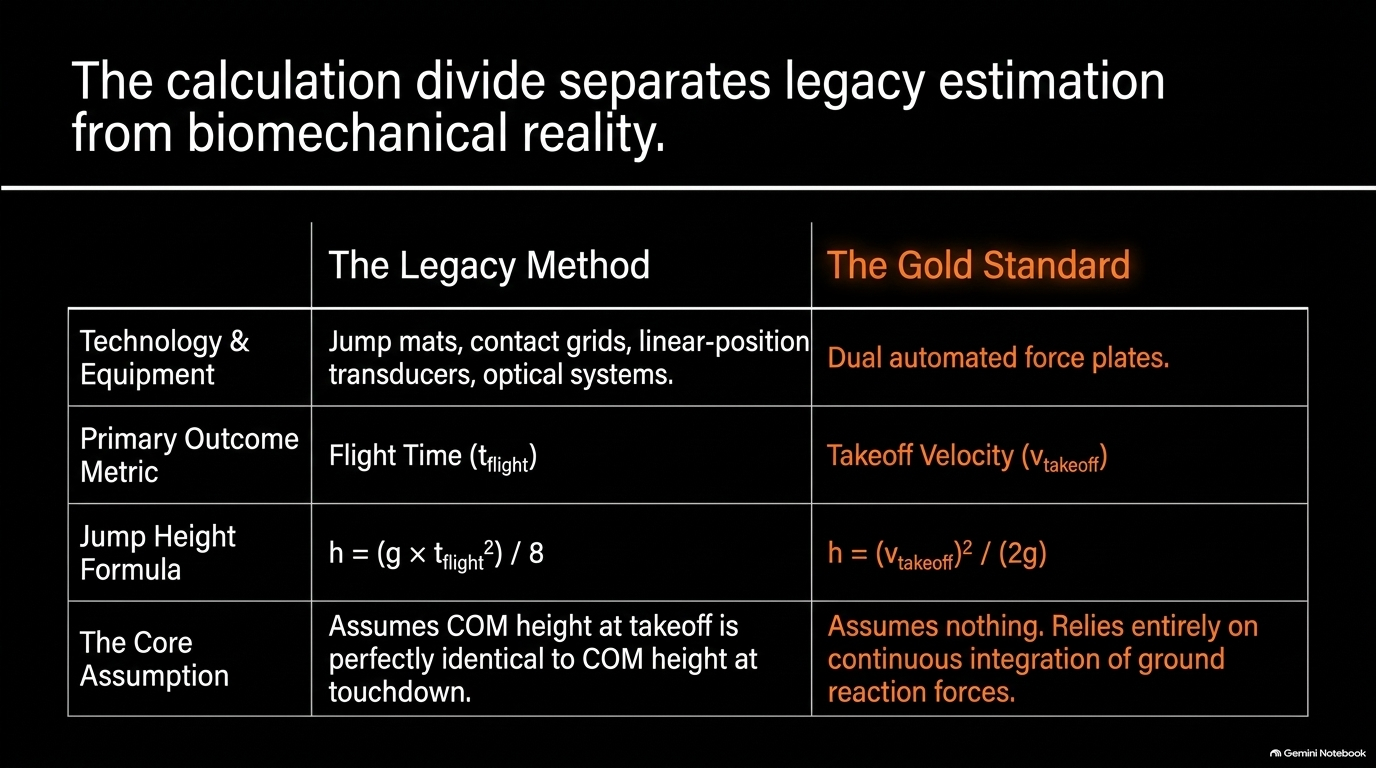
A major distinction in jump testing methodology is how jump height is calculated: Takeoff Velocity vs. Flight Time.
The Legacy Method: Flight Time Calculation
Legacy jump testing equipment—such as jump mats, contact grids, accelerometers, linear-position transducers, and optical systems—calculate jump height exclusively from total flight time (t_flight) using the kinematic equation:
Flight Time Jump Height Formula: h = (g × t_flight²) / 8
**The Flaw in Flight Time:**Calculating jump height from flight time relies on a critical, often invalid assumption: that the athlete's center-of-mass height at takeoff is identical to their center-of-mass height at touchdown. In practical athletic testing, this assumption frequently fails due to:
Tucked Knees or Lifted Feet: Athletes can artificially inflate flight time by tucking their knees or flexing their hips/ankles prior to landing.
Altered Landing Mechanics: Landing with greater knee or hip flexion delays plate contact, making flight time appear longer without increasing true vertical COM displacement.
Overinflated Outcome Metrics: Legacy devices often report artificially elevated jump heights because they measure time in the air rather than true momentum generated off the ground.
The Gold Standard: Takeoff Velocity Derivation
Dual force plates eliminate these artificial errors by using Takeoff Velocity—the industry gold-standard method for determining vertical jump height.
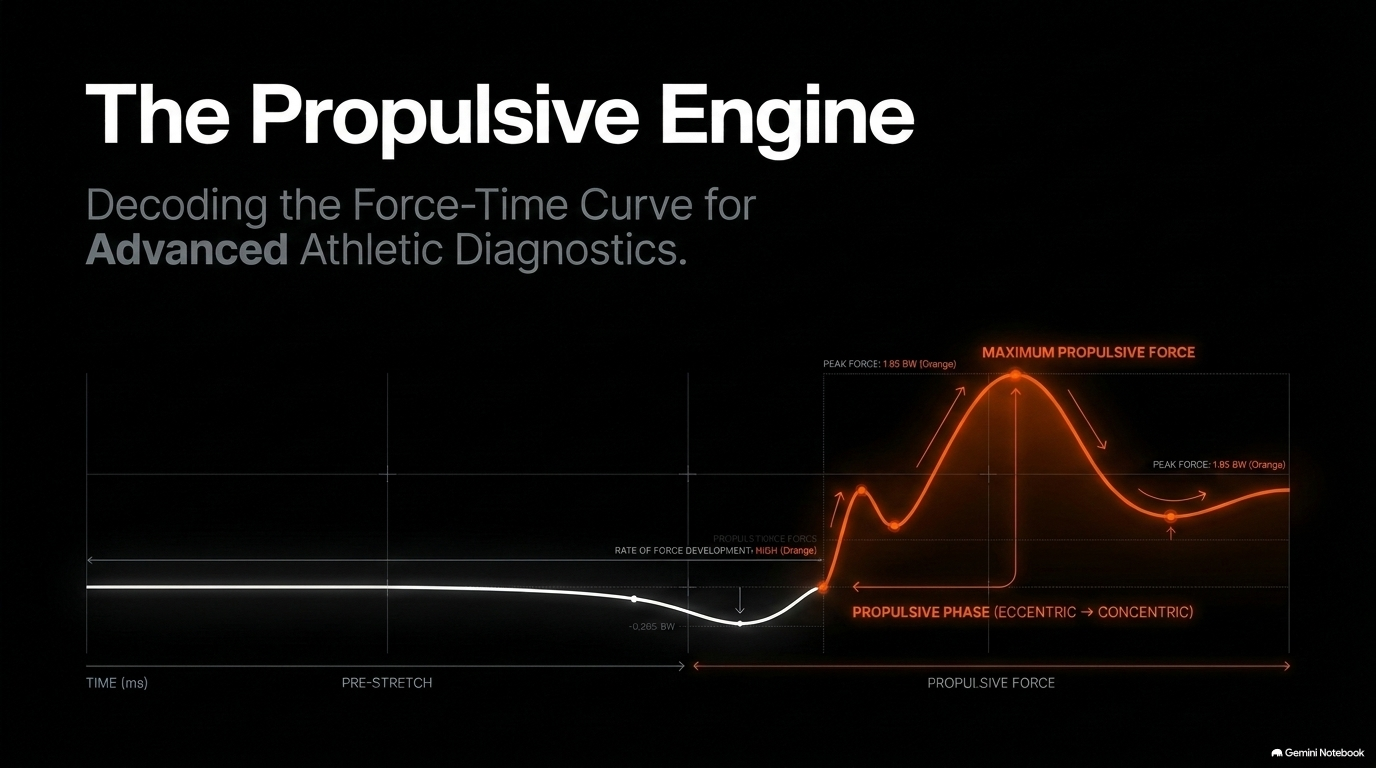
Rather than relying on time spent in the air, force plates continuously integrate vertical ground reaction forces throughout the propulsive duration up to the instant of takeoff to derive propulsive net impulse and takeoff velocity (v_takeoff):
Takeoff Velocity Formula: v_takeoff = Propulsive Net Impulse / System Mass
Impulse-Derived Jump Height Formula: h = (v_takeoff)² / (2g)
Because takeoff velocity is determined before the athlete leaves the ground, it cannot be manipulated by airborne body position, knee tucking, or delayed landing strategies.
3. Key Flight Metrics and Performance Indicators
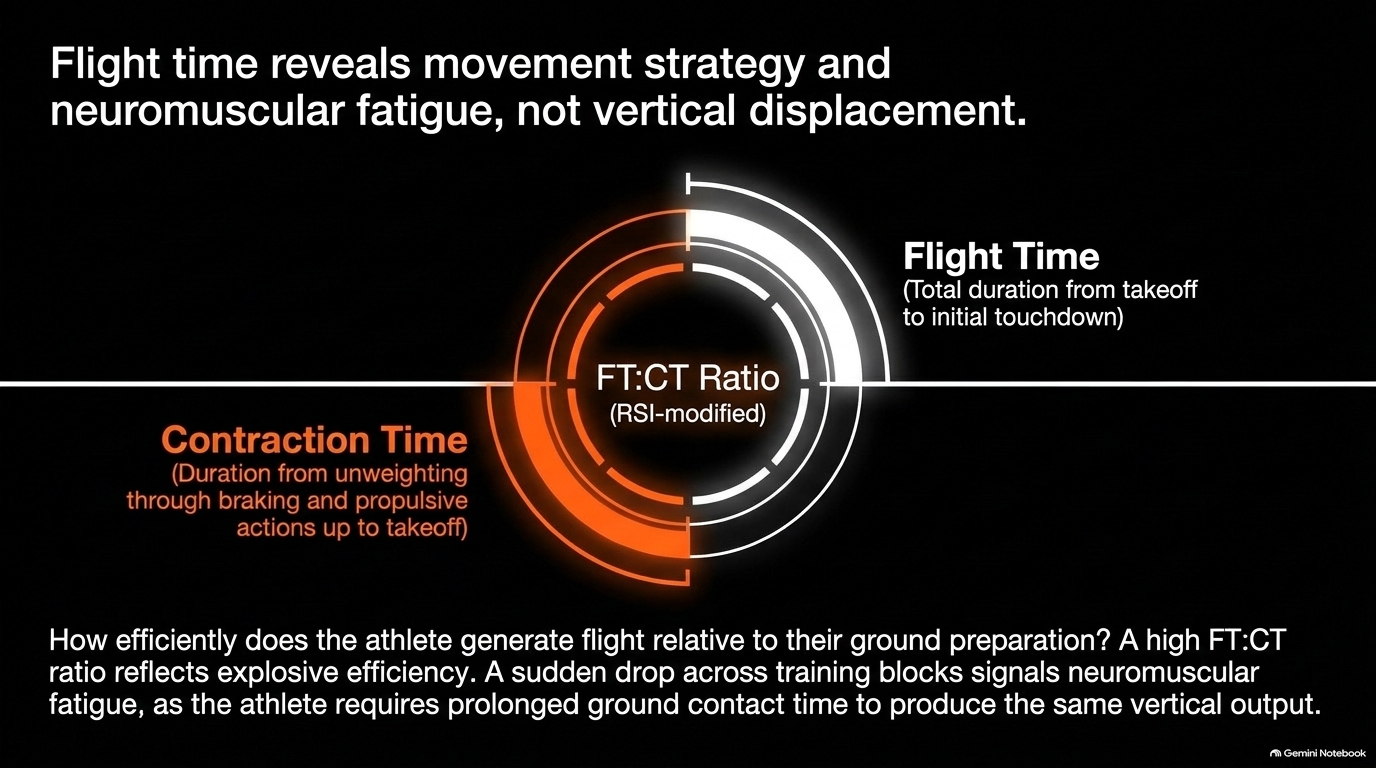
While Hawkin Dynamics relies on takeoff velocity for jump height, measuring time spent in the air remains valuable for assessing movement strategy and neuromuscular fatigue when combined with time-to-takeoff:
Flight Time (s): The total duration elapsed from takeoff to initial touchdown contact.
Contraction Time / Time to Takeoff (s): The total duration from the initiation of movement through unweighting, braking, and propulsive actions up to takeoff.
Flight Time to Contraction Time Ratio (FT:CT / RSI-modified): Calculated as Flight Time divided by Contraction Time:
FT:CT Formula: FT:CT = Flight Time / Contraction Time This ratio serves as an indicator of movement strategy and explosive efficiency. A higher FT:CT ratio reflects an athlete who achieves airborne time efficiently relative to the time spent preparing and executing the jump on the ground.
4. Airborne Positioning and Landing Preparation
The flight period is not merely passive air time; it reflects how an athlete prepares for ground contact and impact force absorption.
Kinematic Positioning: During flight, the athlete extends their lower limbs to prepare for initial ground contact.
Impact Energy Absorption: The velocity at touchdown is directly proportional to takeoff velocity and jump height. Higher jumps result in higher landing velocities, requiring greater eccentric force production during the subsequent landing phase to decelerate center-of-mass velocity back to zero.
Limb Preference Pre-Signals: Asymmetric limb positioning during flight often carries over into landing, where force plates measure discrepancies in force absorption between the left and right legs.
5. Practical Coaching Takeaways
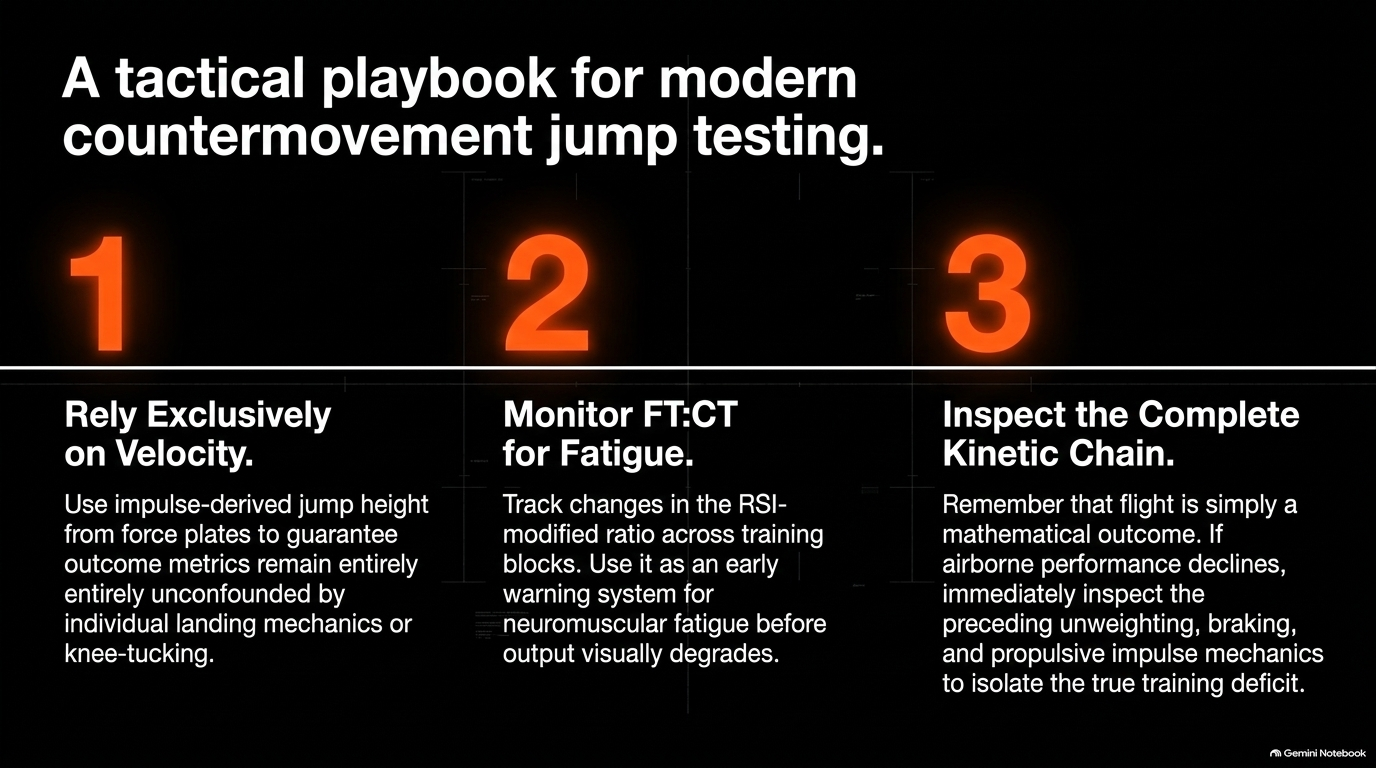
Rely on Takeoff Velocity: Use force plate impulse-derived jump height to ensure testing data remains unconfounded by knee-tucking or landing mechanics.
Monitor FT:CT for Fatigue: Track changes in FT:CT (RSI-modified) across training blocks. A drop in FT:CT often indicates neuromuscular fatigue, where athletes require prolonged ground contact time to produce vertical flight.
Evaluate the Complete Kinetic Chain: Remember that flight time is the outcome of the unweighting, braking, and propulsive actions performed on the ground. When flight performance declines, inspect the preceding impulse mechanics to target the exact deficit in training.
References
Bell, K., & Berberet, D. (Hawkin Dynamics Performance Team). The Countermovement Jump Playbook (eBook v1). Hawkin Dynamics.
McMahon, J. J., Suchomel, T. J., Lake, J. P., & Comfort, P. (2018). Understanding the Key Phases of the Countermovement Jump Force-Time Curve. Strength & Conditioning Journal, 40(4), 96–106. DOI: 10.1519/ssc.0000000000000375
what to read next
THE UNWEIGHTING PHASE: UNDERSTANDING THE FREE FALL OF FORCE PLATE ASSESSMENT
The unweighting phase initiates the countermovement jump as anti-gravity muscles rapidly relax, causing vertical ground reaction force to drop below body weight and allowing gravity to accelerate the athlete downward into "free fall." This rapid descent accumulates negative momentum and generates unweighting impulse, which, according to the equal area law of impulse physics, mathematically dictates the exact braking impulse required to decelerate the body. By understanding unweighting mechanics, practitioners can better evaluate an athlete's countermovement strategy and cue a fast, reactive drop that maximizes stretch-shortening cycle performance and downstream jump height.
THE QUIET PHASE: WHY STANDING STILL IS THE MOST IMPORTANT PART OF FORCE PLATE TESTING
While explosive movement gets all the attention in countermovement jump testing, data accuracy depends entirely on the initial standing baseline. During the quiet phase, force plates measure an athlete’s system weight in Newtons, establishing the zero-point baseline required to calculate net force, velocity, power, and jump height. By enforcing a strict one-to-two-second motionless stance, coaches eliminate calculation errors, protect test validity, and gain a reliable passive tool for tracking body mass and recovery trends over time.
THE PROPULSIVE PHASE: UNDERSTANDING PROPULSIVE IMPULSE AND CONCENTRIC FORCE PRODUCTION IN COUNTERMOVEMENT JUMP TESTING
The propulsive phase begins when upward center-of-mass velocity turns positive after the dip and ends the instant the feet leave the force plates. Driven by triple extension of the hips, knees, and ankles, this phase centers on propulsive net impulse, which directly dictates takeoff velocity and final jump height. By tracking metrics like peak relative propulsive power and bilateral asymmetries, coaches can pinpoint concentric deficits and program targeted lifts—like pin squats, trap bar jumps, and cleans—to build explosive push-off power.
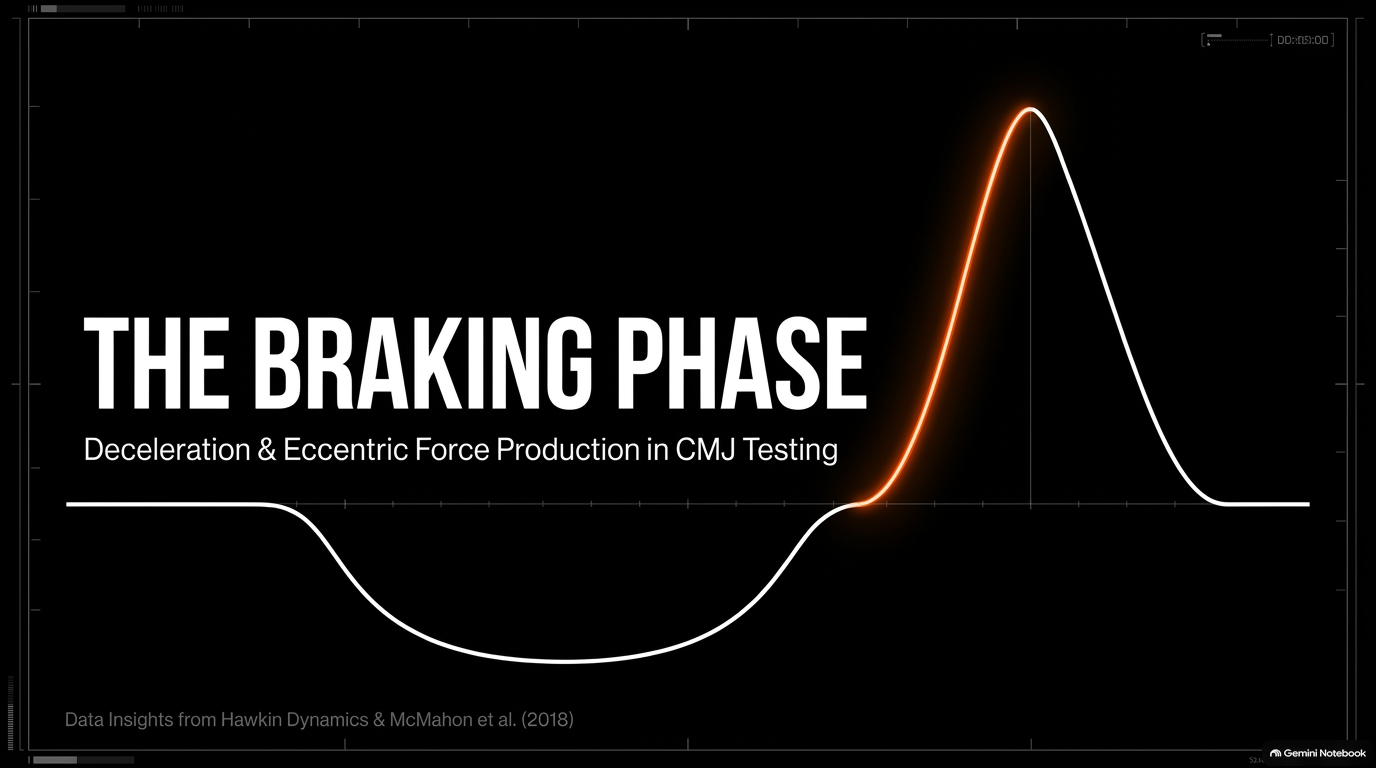
THE BRAKING PHASE: UNDERSTANDING DECELERATION AND ECCENTRIC FORCE PRODUCTION IN COUNTERMOVEMENT JUMP TESTING
The braking phase quantifies an athlete's eccentric deceleration capacity, beginning when ground reaction force surges back above System Weight and concluding when downward center-of-mass velocity reaches exactly zero at the transfer point. During this window, anti-gravity muscles actively generate eccentric force to arrest downward momentum and load the stretch-shortening cycle. Grounded in impulse physics, the net braking impulse must equal the preceding unweighting impulse, making metrics like peak braking force and eccentric rate of force development (RFD) critical for evaluating how efficiently an athlete decelerates mass before transitioning into concentric propulsion.